

FISCAL ACCOUNTABILITY
In 2010, Thomas Bowler launched a campaign platform based on “advancing accountability during serious economic times”, and called for a State audit of the outgoing Sheriff’s budget.
NOW, WE ARE LOOKING TO DO THE SAME
Today*, the Sheriff’s website states “As chief law enforcement officer in Berkshire County, Sheriff Bowler oversees an average daily inmate population of nearly 400.”
NOT TRUE
TODAY THE POPULATION IS CLOSER TO 150
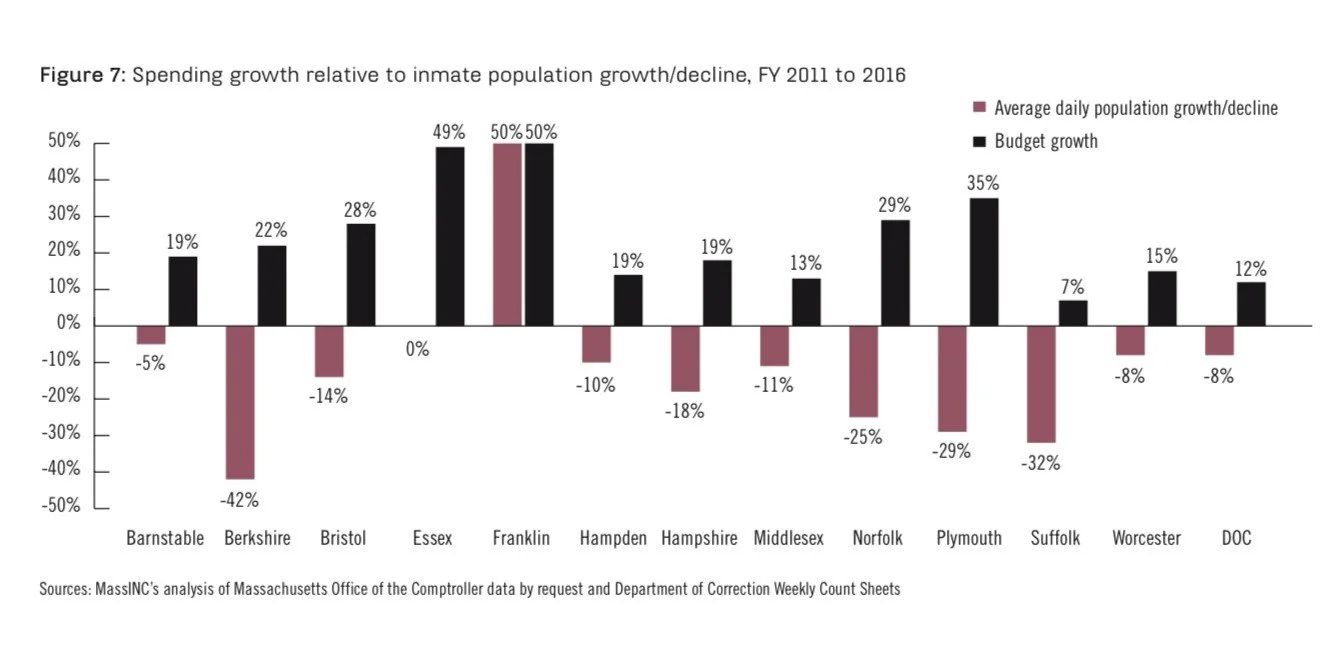
In 2016, a Statewide study on prison overspending found that while the inmate population was steadily falling in Berkshire County, spending was steadily rising. Michael Widmer, the former head of the Massachusetts Taxpayer’s Foundation said at the time, regarding the budget expenses, that it makes no sense: “It’s a huge question what’s going on,” he said. “But it’s likely there’s some padding of the payroll.”**
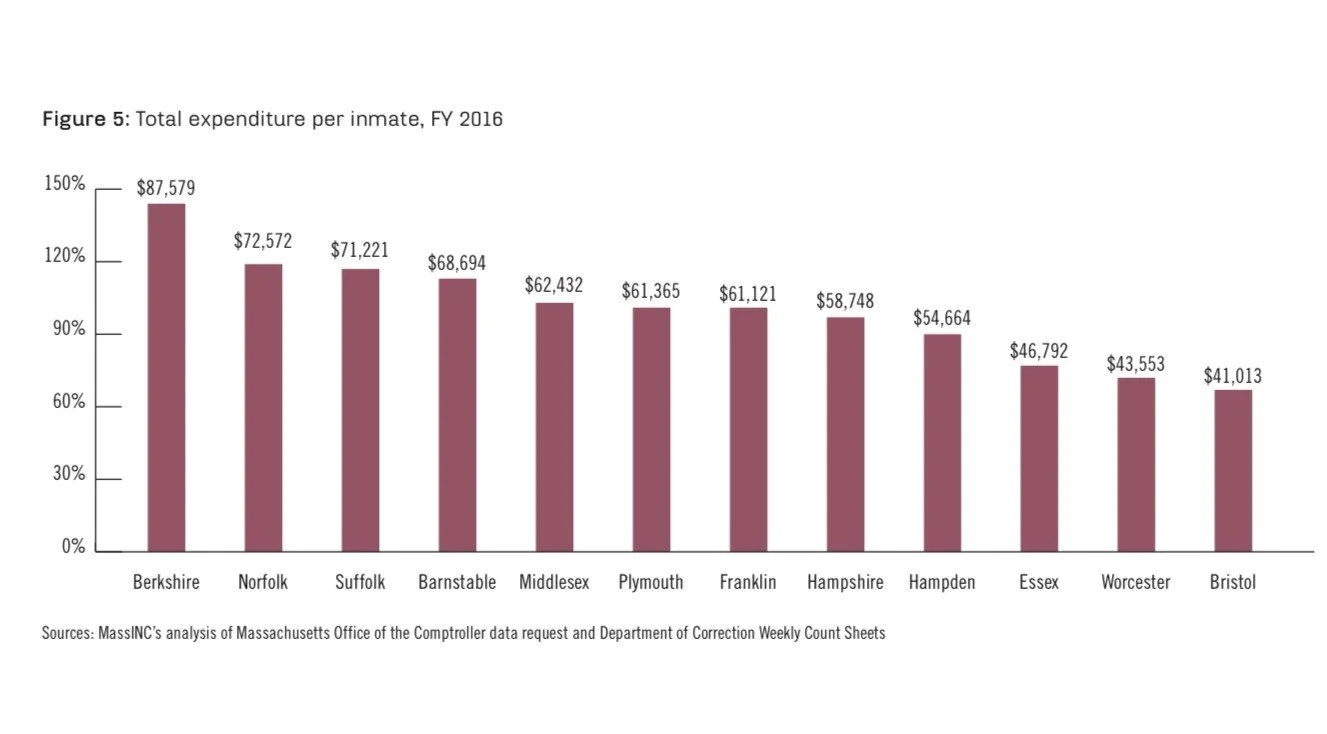
In 2016, Widmer found that the Berkshire County Sheriff’s Office had the highest total expenditure per inmate in the State, at $87,579 per inmate, while Berkshire County itself had the lowest median household income in the State.
For comparison, Bristol County’s annual expenditure per inmate was $41,103 (see image below). For an even more shocking comparison, 2016 Harvard University full tuition, including class tuition, health services, student services fee, AND room and board, was $60,659.
Since 2016, during the Sheriff’s second term in office, the problem has only gotten worse.
By 2020, the Sheriff’s budget, which was $15.22 million in 2011 had increased to $22 million, and $6 million of that increase went entirely to payroll. Meanwhile, the daily inmate population had continued to fall and averaged 155 in 2020. That’s a 45% increase in budget from 2011 to 2020, and a 59% drop in inmate population during those years.
The inmate population fell again in 2021, hitting a record low daily average of 137 (average of 12 months per Mass.gov). For 2021, we calculate the total average expenditure per inmate was $151,678, that’s a 73% increase since 2016!
Please take a look at the charts below and join me for change in September as we demand fiscal accountability to the taxpayers.


sources for graphs and data:
https://massinc.org/wp-content/uploads/2017/05/Getting-Tough-on-Spending-1.pdf
https://cthruspending.mass.gov/#!/year/2020/explore/0-/department/SHERIFF+DEPARTMENT+BERKSHIRE+(SDB)/0-/cabinet_secretariat
*On June 30, 2022: https://bcsoma.org/about-us/sheriff-bowler/
**https://commonwealthmagazine.org/criminal-justice/report-inmate-levels-down-but-spending-keeps-rising/
https://www.mass.gov/lists/weekly-inmate-count-2022
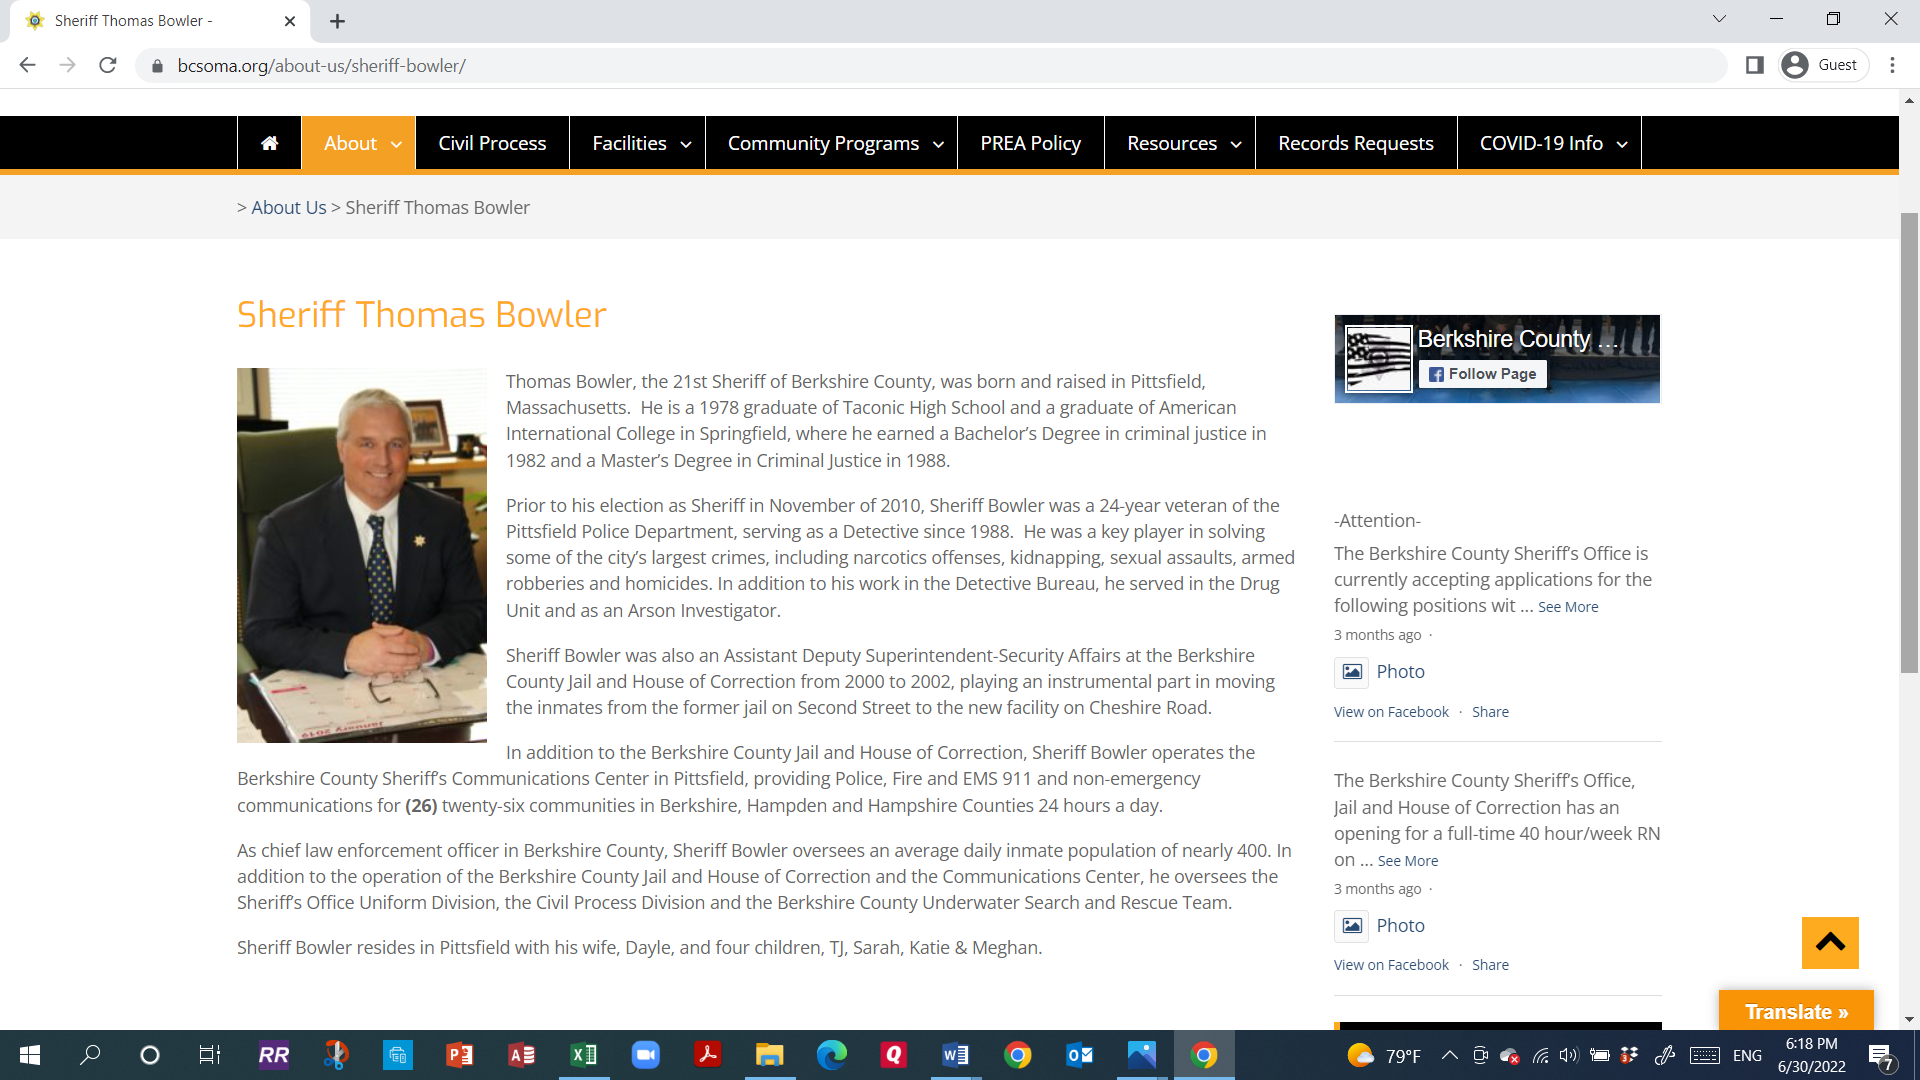
WEBSITE CLAIM: “As chief law enforcement officer in Berkshire County, Sheriff Bowler oversees an average daily inmate population of nearly 400.”
NOT TRUE. This creates a lack of transparency for County voters. It may have been true in 2010, but the public deserves to be kept informed of changes in the budget and inmate population.
